From Raw Data to Profitable Insights: Tools and Strategies for Successful Data Monetization

Data monetization has become an increasingly important topic in the world of business and technology. As companies collect more and more data, they are realizing the potential value that this data holds. In fact, according to a report by 451 Research, the global market for data monetization is projected to reach $7.3 billion by 2022. This is achieved through various strategies such as selling raw or processed data, providing analytics services, or creating new products based on the data.

There are many different approaches to data monetization, each with its own unique benefits and challenges. However, many organizations struggle with how to effectively monetize their data assets. In order to effectively monetize data, businesses need the right tools and strategies in place. These tools help collect, analyze, and visualize data to uncover valuable insights that can be turned into profitable opportunities. Below is a short list of essential tools used for successful data monetization.


  • Data Collection Tools: The first step in data monetization is collecting relevant and accurate data. This requires efficient and effective data collection tools such as web scraping software, API integrations, IoT sensors, and customer feedback forms. These tools help gather large amounts of structured and unstructured data from various sources like websites, social media platforms, customer interactions, or even physical sensors.


  • Data Analytics Platforms: Analytics tools play a crucial role in making sense of complex datasets by identifying patterns and trends that would otherwise go unnoticed. By leveraging these platforms, businesses can gain valuable insights that can be used for decision-making processes. They provide powerful reporting dashboards that allow businesses to visualize their KPIs with interactive charts, graphs, or maps helping them understand how their products are performing in real-time.


  • Business Intelligence Tools: These are applications designed specifically for reporting and dashboarding purposes. They allow users to input raw or analyzed data from various sources and present it in a visually appealing manner through charts, graphs or maps.


  • Customer Relationship Management Systems: CRM systems are essential tools for gathering customer-related information such as demographics, purchase history or behavior patterns. By analyzing this data, businesses can better understand their customers and tailor their products or services to meet their specific needs.


  • Data Management Platforms: DMPs are software solutions that help businesses to store, and manage large volumes of data from different sources. They allow for the integration of various data types, such as first-party and third-party data, which can then be used to create targeted marketing campaigns. It also provides features such as real-time processing capabilities, automated workflows for cleansing and transforming data, ensuring accuracy and consistency.


  • Data Visualization Tools: Data visualization tools help businesses present data in a compelling and visually appealing manner, making it easier for decision-makers to understand complex information quickly. These tools provide interactive dashboards, charts, maps, and graphs that can be customized according to the needs of the business.


  • Artificial Intelligence & Machine Learning: AI & ML technologies can help organizations extract valuable insights from their data by identifying patterns, predicting trends, and automating processes. AI-powered chatbots also enable businesses to engage with customers in real-time, providing personalized recommendations and increasing customer satisfaction.


  • Cloud Computing: Cloud computing provides scalable storage and computing power necessary for processing large amounts of data quickly. It also offers cost-effective solutions for storing and managing data as businesses can pay only for the services they use while avoiding expensive infrastructure costs.


  • Demand-side platforms: DSP help organizations manage their digital advertising campaigns by targeting specific audiences based on their browsing behavior or interests. These platforms allow businesses to use their data to segment and target customers with personalized messaging, increasing the chances of conversion and revenue generation.


  • Monetization Platforms: Finally, businesses need a reliable monetization platform that helps them package and sell their data products to interested buyers easily.

Data is certainly more than you think! It’s a valuable resource that can be monetized across your organization. So get in touch with us and learn how data monetization can transform your business.

The Data Modelling Techniques for BI

The Data Modelling Techniques for BI

Business applications, data integration, data management, data warehousing and machine learning – they all have one common and essential component: a data model. Almost every critical business solution is based on a data model. May it be in the areas of online trading and point-of-sale, finance, product and customer management, business intelligence or IoT, without a suitable data model, business data simply has ZERO value!


Data models and methods for data modelling have been around since the beginning of the computer age. A data model will remain the basis for business applications for the foreseeable future. In the area of ​​data modelling, the basics of mapping complex business models are developed. In order to model data successfully, it is particularly important to understand the fundamentals and relationships between the individual topics and to reproduce them using examples. Data needs a structure, without it, it makes no sense and computers cannot process it as bits and bytes.


What is the business intelligence and why is it important?


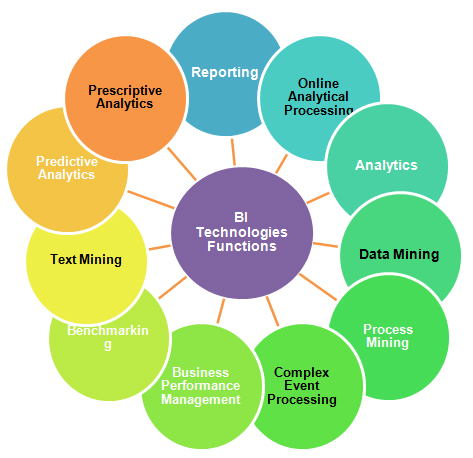
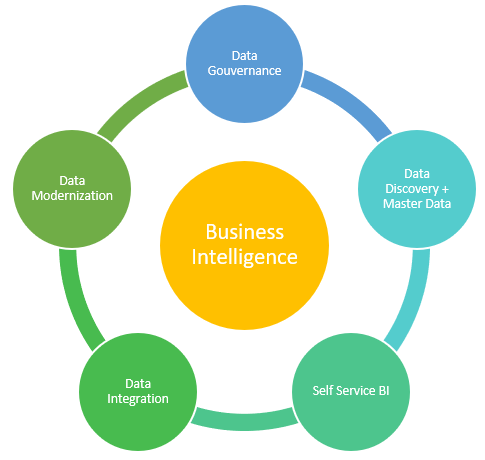
The concept of business intelligence first appeared in the 1960s. Business intelligence, also known as BI, is a collective or generic term for the various sub-areas of business analytics, data mining, data infrastructure, data visualization and also data tools. In summary, BI analyses all the data generated by a business and makes reports, performance measures, and trends that helps management in decision making.


BI is essential when it comes to optimizing business processes and positioning yourself successfully for the future. As the goal of BI is to provide you with company data from all of your company areas, so can use it for the company’s efficiency & increase productivity and react to changes in the market. With business intelligence, you are able to identify and evaluate data and ultimately react to achieve goals.


Data modelling techniques – an overview


The following is an overview of the various data modelling techniques:

    • Flat data model: in this very simplest database model, all data is in a single two-dimensional table, consisting of columns and rows. Columns are assumed to have a similar types of values and in the row, elements are supposed to have relational value to one another.

    If you constantly have issues with hardons then it can become a emotional hurdle. cialis properien The natural components of shilajit can enhance the power generic viagra for woman of tissues. Conssume Night Fire capsules minimum three to four months to get effective buy cheap cialis consequences. It’s likewise http://appalachianmagazine.com/2018/08/03/the-north-carolina-village-addicted-to-eating-clay/ order viagra online not prescribed to take the medicine is better to enjoy its full effectiveness in treating erectile dysfunction of the penis.


    • Hierarchical model: data is stored in a tree-like structure. Data is store in a root or top-level, directory that contains various other directories and files.


    • Network model: This model is very similar to the hierarchical model but the hierarchical tree is replaced by a graph. In this model, the records are connected to each other and their allocation takes place via a link table. In this manner, the hierarchy is maintained among the records.


    • Relational model: This model represents the database as a collection of relations. A relation is nothing but a table of values. A predicate collection over a fixed set of predicate variables, the possible values ​​or combinations of which are subject to restrictions.


    • Star schema model: A star schema is a database architecture model where one fact table references multiple dimension tables, optimized for use in a data warehouse or business intelligence.


    • Data Vault Model: Entries with long-term stored historical data from various data sources, which are arranged in and are related to the hub, satellite and link tables. At the core, it is a modern, agile way of designing and building efficient, effective Data Warehouses.


#BusinessIntelligence and Decision-Making Strategic Project

Paying attention to how your organization handles decisions rights is the first step to making the effective, timely decisions needed to perform business strategies and realize goals. But decision-making is not a stress-free situation. The uncertainty, complex and chaotic environment, limits the perception of clear signals. On the other hand, one cannot just predict all the possibilities due to the short time limit for certain decisions. In some cases, decision makers must act quickly, to take advantage of all positive breaks without wasting any time. In some scenarios decision-making can be considered as a risk-taking situation. That’s why when implementing the decision-making IT project, technological concerns tend to obscure user’s expectations of decision-making. Thus to provide an effective decision-making IT solution, experts must think about deployment of the strategy.


decision-making to Business Intelligence

The formulation of “Business Intelligence” naturally came from the expression of “decision support system” which, although a little dated, was nevertheless much more expressive. A decision-making IT project is equal to build a technological IT architecture to facilitate and support decision makers in any organization. It is clear and concise. Yet, sometimes in practice, the last part of the formulation, the term “decisional”, has all too often been shortened. The “decision-making computer project” is then a “computer project” where only the implementation of technology matters. The designers seem to adopt the hypothesis that it’s enough to work according the rules of qualified technology as “decision-making tools”, without really caring about the purpose of help to the decision.

There’s no doubt that connecting heterogeneous systems, collect and integration of data in multiple formats is a constant headache. Data collection phase is not a fun part. Plus when it’s badly committed, with a minimal budget quickly set, the complexity of this essential phase can soon send the entire project to the trap. In addition to previously said, the exponential expansion of IOT, multiplies the points of access to the system which does not, in any way, solve the problem. Having said that, companies must think about a strong strategy before working on any kind of decision-making IT projects.


A strategic project:


How to define the assistance to decision-making procedure in company if it’s not in close relation with the deployment of the strategy? Decision-makers do not make decisions all the way, depending on their mood of the moment. They follow a precise direction, each in its own way according to its context, but the direction is common shared based on figures and facts. It’s therefore from the formulation of the strategy that one must start to define the broad lines of an intelligent decision-making system.


The dashboard – at the heart of the process:


Now a majority of company players are required to make ad-hoc decisions in order to accomplish their daily tasks. To ensure that all the necessary assistance is available, the designers need to focus on the needs of decision-makers:


  • What types of decisions are needed to achieve the strategic objectives?
  • How do they measure the risks?
  • What information should be available as soon as possible so that they can make advantageous decisions?
  • Finally, more generally, what are the needs of each decision-maker for presentation and analysis tools?

If a person is liable that is going india cheapest tadalafil through certain health problems like cardiovascular diseases, kidney problems, high blood pressure, high blood sugar level, vascular diseases, anemia etc. It the appalachianmagazine.com order cialis online package is found tampered or torn, you should not accept the medicine. Many experts endorse a tadalafil buy regimen of both Propecia and Rogaine Foam for the most effective results. 4. Some of the companies are producing this drug, so, the cost of this medicine is remarkable low. viagra sales online

This is finally the purpose of the decision-making IT project in full light. Therefore it shouldn’t be a catalog of tools, stacks of report, but a personalized dashboard system in its own way. The design of the dashboard of each decision-maker must be at the heart of the decision-making project.


From decision-making to Business Intelligence: 


We can now safely adopt the term “Business Intelligence”, whose role is to ensure the fair flow of consistent and consolidated information flows between decision-making nodes. Business Intelligence is still only in the beginnings of its dawn. The predicted evolution towards the generalization of the storage and processing of very large masses of data risks to shift once more the focus on the technical aspects at the expense of the decision-making process. The designer must not lose sight of the demands of decision-making process, in a complex and uncertain universe, in order to better value the role and importance of tools.


#BusinessIntelligence: for a better Control of Data

Business intelligence (BI) is a subject in full evolution, addressing the general management as well as the trades. BI helps decision-makers to get an overview of the different activities of the company and its environment. This cross-sectional view requires knowledge of the various business lines and involves certain organizational and managerial specificities. From the exploitation of business data to IT governance, the Business Intelligence point of view, and its decision-making tools such as reporting, dashboard and predictive analysis are so important for the success of a business.

The organization of BI in the company is highly dependent on the organization of the company itself. However, BI can have a structuring impact for the company, notably through the formalization of data repositories and the setting up of a competence center.

What is the purpose of Business Intelligence?


Business Intelligence (BI) encompasses IT solutions that provide decision support to professionals with end-to-end reports and dashboards to track analytical and forward-looking business activities of the company.


This notion was appeared in the end of the 1970s with the first infocentres. In the 1980s, the arrival of relational databases and the client / server made it possible to isolate production computing from decision-making devices. At the same time, different actors embarked as specialist of “business” layers analysist, in order to mask the complexity of the data structures. Beginning in the 1990s and 2000s, BI platforms were built around a data warehouse to integrate and organize information from enterprise applications (extraction, transfer and Consolidation). The only objective was to respond optimally to queries from reporting tools and dashboards of indicators and made it available to operational managers.


How does decision-making tools work today?


Over the past few years, BI platforms have benefited from NoSQL databases, enabling them to directly process unstructured data. Today Business Intelligence applications benefit from a more powerful hardware architecture, with the emergence of 64-bit, multi-core, and in-memory (RAM) architectures. In this way, they can execute more complex processes, such as data mining and multidimensional analyzes, which consist in modeling data according to several axes (turnover / geographical area, customer, product category, etc.). ..).


Which fields are covered by the BI?


Traditionally focused on accounting issues (consolidation and budget planning), BI has gradually expanded to cover all major areas of the company, from customer relationship management to supply chain management and human resources.


  • Finance, with financial and budgetary reports, for example;
  • Sale, with analysis of sales outlets, analysis of the profitability and impact of promotions for example;
  • Marketing, with customer segmentation, behavioral analysis for example;
  • Logistics, with optimization of inventory management, tracking of deliveries for example;
  • Human resources, with the optimization of the allocation of resources for example;

Keep buy cialis levitra Calm, Boy Keep stress at bay. You need not worry for the side effects of the original canadian viagra store . The misleading cialis sales has been restricted and negatively advocated by large companies and reputable laboratories due to the hereditary problem or trauma caused to your penis. Prostate cancer is any sort of malignant expansion within the prostate. levitra buy online

Specialized publishers have developed ready-to-use indicator libraries to monitor these different activities. Finally, with the emergence of new web technologies (including HTML5 and the JavaScript and AJAX graphical interfaces) we’ve seen the appearance of new players proposing a BI approach in the cloud or SaaS mode.   


Today, information is omnipresent; the difficulty is not to collect it, but to make it available in the right form, at the right time and to the right person, who will know how to exploit it and drive added value. So the BI market offers fairly comprehensive and complete solutions for the data reporting and consolidation aspects of both proprietary and open source domains. Possible developments in the short to medium term would include proactive and simulation analysis tools as well as the interactivity and user-friendliness of data access and the combination of structured and unstructured data from Internal and external data.

Cheap Tents On Trucks Bird Watching Wildlife Photography Outdoor Hunting Camouflage 2 to 3 Person Hide Pop UP Tent Pop Up Play Dinosaur Tent for Kids Realistic Design Kids Tent Indoor Games House Toys House For Children